How To Interpret The Net Asset Value (NAV) Of The Amundi Dow Jones Industrial Average UCITS ETF

Table of Contents
What is Net Asset Value (NAV) and why is it important?
The Net Asset Value (NAV) represents the per-share value of an ETF's underlying assets. For the Amundi Dow Jones Industrial Average UCITS ETF, this signifies the collective value of its holdings in the 30 companies comprising the prestigious Dow Jones Industrial Average, less any liabilities. Think of it as the true intrinsic value of your investment in the ETF.
-
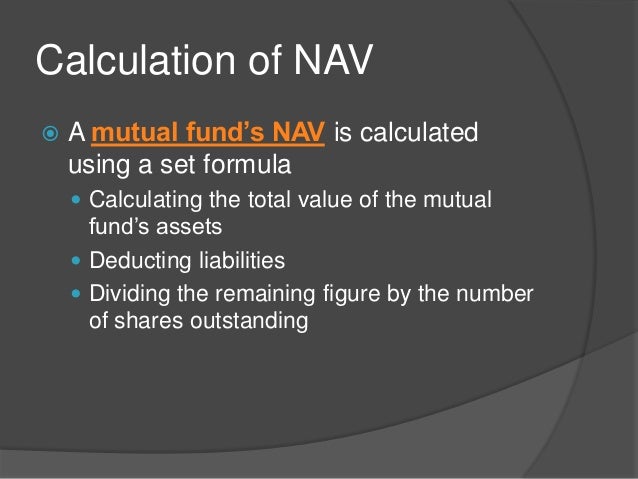
Defines NAV: The NAV is calculated by taking the total market value of all the ETF's assets (the 30 Dow Jones stocks) and subtracting any liabilities such as management fees, administrative costs, and other expenses.
-
Importance for Investors: Monitoring the NAV is paramount for tracking your investment's performance. Changes in the NAV directly reflect the overall performance of the underlying Dow Jones Industrial Average index. A rising NAV indicates growth in your investment, while a declining NAV signifies a decrease. Regularly comparing the NAV to the ETF's market price helps you understand any discrepancies and potential trading opportunities.
-
NAV vs. Market Price: While the ETF's market price and its NAV are usually very close, temporary deviations can occur due to market supply and demand. Understanding this difference is critical for making smart trading decisions. A large discrepancy might present an opportunity to buy low or sell high.
How is the NAV of the Amundi Dow Jones Industrial Average UCITS ETF calculated?
The NAV of the Amundi Dow Jones Industrial Average UCITS ETF is calculated daily, typically at the close of the market, through a precise process:
-
Daily Calculation: The NAV calculation is a daily occurrence, providing investors with an up-to-date view of their investment’s value.
-
Asset Valuation: The first step involves determining the current market value of each of the 30 constituent companies within the Dow Jones Industrial Average held by the ETF. This is done using the closing prices of those stocks.
-
Liability Deduction: All expenses incurred by the ETF, including management fees, operating costs, and other liabilities are meticulously deducted from the total asset value.
-
Per-Share Value: Finally, the resulting net asset value (after subtracting liabilities) is divided by the total number of outstanding ETF shares. This gives the NAV per share, the figure most relevant to individual investors.
Factors Influencing the NAV of the Amundi Dow Jones Industrial Average UCITS ETF
Several factors influence the fluctuations of the Amundi Dow Jones Industrial Average UCITS ETF's NAV. Understanding these factors allows for a more nuanced interpretation of your investment performance.
-
Dow Jones Industrial Average Performance: The primary driver of the ETF's NAV is the overall performance of the Dow Jones Industrial Average itself. Positive index movements generally translate into NAV increases, while negative movements lead to NAV decreases. This is because the ETF aims to mirror the index's performance.
-
Currency Fluctuations: If the ETF holds assets denominated in currencies other than your base currency, exchange rate fluctuations can directly impact the NAV. A strengthening of the base currency against the holdings' currency can decrease the NAV, while the reverse is also true.
-
Dividend Distributions: When the underlying companies in the Dow Jones Industrial Average pay dividends, the ETF receives these dividends and distributes them to its shareholders. This distribution reduces the ETF's overall asset value, consequently lowering the NAV.
-
Management Fees and Expenses: While usually a relatively small factor compared to index performance, management fees and other operating expenses reduce the overall asset value and thus the NAV. These are deducted during the NAV calculation process.
Understanding the Amundi Dow Jones Industrial Average UCITS ETF's specific characteristics.
The Amundi Dow Jones Industrial Average UCITS ETF utilizes a full replication strategy, meaning it aims to hold all 30 components of the Dow Jones Industrial Average in the same proportions as the index. This generally leads to a very close tracking of the index's performance and therefore a highly reliable NAV. It is important to review the ETF's Key Information Document (KID) for the precise details on its replication method and any specific fees or expense ratios. This document will provide a transparent overview of the investment's costs and any potential impacts on the NAV.
Conclusion:
Interpreting the Net Asset Value (NAV) of the Amundi Dow Jones Industrial Average UCITS ETF is vital for effective portfolio management. By understanding how the NAV is calculated and the key factors that affect it – including the Dow Jones Industrial Average performance, currency fluctuations, dividends, and expenses – investors can effectively monitor performance and make informed decisions. Regularly checking the NAV, in conjunction with the market price, provides crucial insights into the success of your investment. Stay informed about the Amundi Dow Jones Industrial Average UCITS ETF's NAV to optimize your investment strategy. Start monitoring your Amundi Dow Jones Industrial Average UCITS ETF's NAV today!

Featured Posts
-
 Country Home Buyers Rejoice Dream Homes Found Under 1m Budget
May 24, 2025
 -
 Is An Escape To The Country Right For You Weighing The Pros And Cons
May 24, 2025
 -
 Nicki Chapman Shares Her Beautiful Chiswick Garden On Escape To The Country
May 24, 2025
 -
 Escape To The Country Overcoming Challenges In A Rural Move
May 24, 2025
 -
 Investment In Amundi Dow Jones Industrial Average Ucits Etf Monitoring Nav Performance
May 24, 2025
Latest Posts
-
 Sharp Decline On Amsterdam Stock Exchange 11 Down In Three Days
May 24, 2025
 -
 Amsterdam Exchange Suffers 11 Drop Since Wednesday Three Days Of Losses
May 24, 2025
 -
 Amsterdam Stock Exchange Plunges Third Consecutive Day Of Heavy Losses
May 24, 2025
 -
 Legal Battle Amsterdam Residents Sue City Council For Tik Tok Driven Overcrowding At Snack Bar
May 24, 2025
 -
 Dazi E Mercati L Impatto Sulle Borse E Le Reazioni Della Ue
May 24, 2025
